前言
在使用prometheus对linux主机进行监控时,除了通过grafana使用图形界面查看数据结合自己的运维经验判断各个指标数值,从而实现对系统情况的掌握。大多数的情况是通过选择性的找出特定的关键指标配置好对应的altermanager告警通过webbook或其他方式直接推送出来实时的提示相关运维人员。本次功能实现是通过prometheus node_exporter alertmanager来接收系统告警并发送至qq邮箱。
环境准备
提前安装配置好prometheus alertmanager node_exporter环境。
prometheus配置及告警规则配置
prometheus.yml属性配置
| 属性 | 描述 |
|---|---|
| scrape_interval | 样本采集周期,默认为1分钟采集一次 |
| evaluation_interval | 告警规则计算周期,默认为1分钟计算一次 |
| rule_files | 指定告警规则的文件 |
| scrape_configs | job的配置项,里面可配多组job任务 |
| job_name | 任务名称,需要唯一性 |
| static_configs | job_name的配置选项,一般使用file_sd_configs 热加载配置 |
| file_sd_configs | job_name的动态配置选项,使用此配置可以实现配置文件的热加载 |
| files | file_sd_configs配置的服务发现的文件路径列表,支持.json,.yml或.yaml,路径最后一层支持通配符* |
| refresh_interval | file_sd_configs中的files重新加载的周期,默认5分钟 |
此处使用rule_files属性来配置告警文件存放位置
# my global config
global:
  scrape_interval:    15s # 采样周期
  evaluation_interval: 15s # 告警规则计算周期
# alertmanager configuration
alerting:
  alertmanagers:
  - static_configs:
    - targets:
      # - alertmanager:9093
# 报警规则文件可以指定多个,并且可以使用通配符*
rule_files:
  - "rules/*.yml"
  # - "second_rules.yml"
此处使用file_sd_configs属性热加载配置文件
# 采集job配置
scrape_configs:
  - job_name: 'prometheus'
    file_sd_configs:
      #指定1分钟加载一次配置
    - refresh_interval: 1m
      files:
      - config_prometheus.json

  - job_name: 'node'
    file_sd_configs:
    - refresh_interval: 1m
      files:
      - config_exporter.json

  - job_name: 'alertmanager'
    file_sd_configs:
    - refresh_interval: 1m
      files:
      - config_alertmanager.json
设置报警规则,rules/node_rules.yml
groups:
# 报警组组名称
    - name: node_rule
      #报警组规则
      rules:
      #告警名称,需唯一
      - alert: server status
        #promql表达式
        expr: up == 0
        #满足此表达式持续时间超过for规定的时间才会触发此报警
        for: 10s
        labels:
          #严重级别
          severity: critical
        annotations:
         #发出的告警标题
          summary: "实例 {{ $labels.instance }} 关闭"
          #发出的告警内容
          description: "系统 {{ $labels.instance }}: 实例关闭"
          ip: "{{ $labels.ip }}"
      - alert: memory usage
        expr: 100 - round(node_memory_memavailable_bytes / node_memory_memtotal_bytes * 100) > 80
        for: 1m
        labels:
          severity: error
        annotations:
          summary: "实例 {{ $labels.instance }} 内存使用率过高"
          description: "实例内存使用率超过 80% (当前值为: {{ $value }}%)"
          ip: "{{ $labels.ip }}"
      - alert: cpu usage
        expr: 100 - round(avg(irate(node_cpu_seconds_total{mode="idle"}[5m])) by(instance)* 100) > 80
        for: 1m
        labels:
          severity: error
        annotations:
          summary: "实例 {{ $labels.instance }} cpu使用率过高"
          description: "实例cpu使用率超过 80% (当前值为: {{ $value }}%)"
          ip: "{{ $labels.ip }}"
      - alert: disk usage
        expr: 100 - round(node_filesystem_free_bytes{fstype=~"ext3|ext4|xfs"}/node_filesystem_size_bytes {fstype=~"ext4|xfs"}*100) > 80
        for: 1m
        labels:
          severity: error
        annotations:
          summary: "实例 {{ $labels.instance }} 磁盘使用率过高"
          description: "实例磁盘使用率超过 80% (当前值为: {{ $value }}%)"
          ip: "{{ $labels.ip }}"
采集任务job配置config_exporter.json配置如下(其他job配置文件类似)
[
  {
    "targets": [ "192.168.134.131:51007"],
    "labels": {
      "instance": "192.168.134.131",
      "ip": "192.168.134.131"
    }
  }
]
alertmanager配置
因为我是通过qq邮箱来发送告警的,所以alertmanager.yml的邮箱配置如下
global:
  #超时时间
  resolve_timeout: 5m
  #smtp地址需要加端口
  smtp_smarthost: 'smtp.qq.com:465'
  smtp_from: '100000@qq.com'
  #发件人邮箱账号
  smtp_auth_username: '100000@qq.com'
  #账号对应的授权码(不是密码),qq邮箱授权码可以在“设置-账户-pop3/smtp服务”里面找到点击开启
  smtp_auth_password: 'xxxxxx'
  smtp_require_tls: false
route:
  group_by: ['alertname']
  group_wait: 10s
  group_interval: 1m
  repeat_interval: 4h
  receiver: 'mail'
receivers:
- name: 'mail'
  email_configs:
  - to: '100000@qq.com'
    send_resolved: true
主要事项:
- smtp.qq.com:465 ,端口使用465。其他资料说用587端口也可以。(如果是云服务器,25端口通常是被服务商封闭的,所有也不能使用25端口)
报错信息:
msg=“notify for alerts failed” num_alerts=1 err="*notify.loginauth failed: 530 must issue a starttls command first." - smtp_require_tls: false 必须加上,因为smtp_require_tls默认为true。
prometheus关联alertmanager
prometheus.yml中的alerting标签下配置上alertmanager的地址即可,配置如下:
# alertmanager configuration
alerting:
  alertmanagers:
  - static_configs:
    - targets: ['192.168.134.131:9093']
重启prometheus和alertmanager
配置完报警规则重启prometheus和alertmanager,访问http://ip:9090/,点击alerts就能看到配置的报警信息了,如下:
#重启软件,linux命令
pkill prometheus      #kill prometheus软件进程
ss -alntup | grep -i 9090      #查看确认9090端口是否杀死,该条命令没有输出表示进程杀死成功
nohup ./prometheus --config.file=/software/prometheus-2.33.3.linux-amd64/etc/prometheus.yml --storage.tsdb.retention.time=90d --log.level=debug > /software/prometheus-2.33.3.linux-amd64/prometheus.log 2>&1 &      #启动prometheus软件,指定配置文件设置数据保留时间为90天设置日志级别
ss -alntup | grep -i 9090      #确认9090端口是否启动,此时命令应该有输出。
pkill alertmanager      #kill alertmanager软件进程
ss -alntup | grep -i 9093      #查看确认9093端口是否杀死,该条命令没有输出表示进程杀死成功
nohup ./alertmanager --config.file=/software/alertmanager/alertmanager.yml --cluster.advertise-address=0.0.0.0:9093 --log.level=debug > /software/alertmanager/alertmanager.log 2>&1 &      #启动alertmanager软件指定配置文件设置监听为0.0.0.0:9093设置日志级别
ss -alntup | grep -i 9093      #确认9093端口是否启动,此时命令应该有输出。
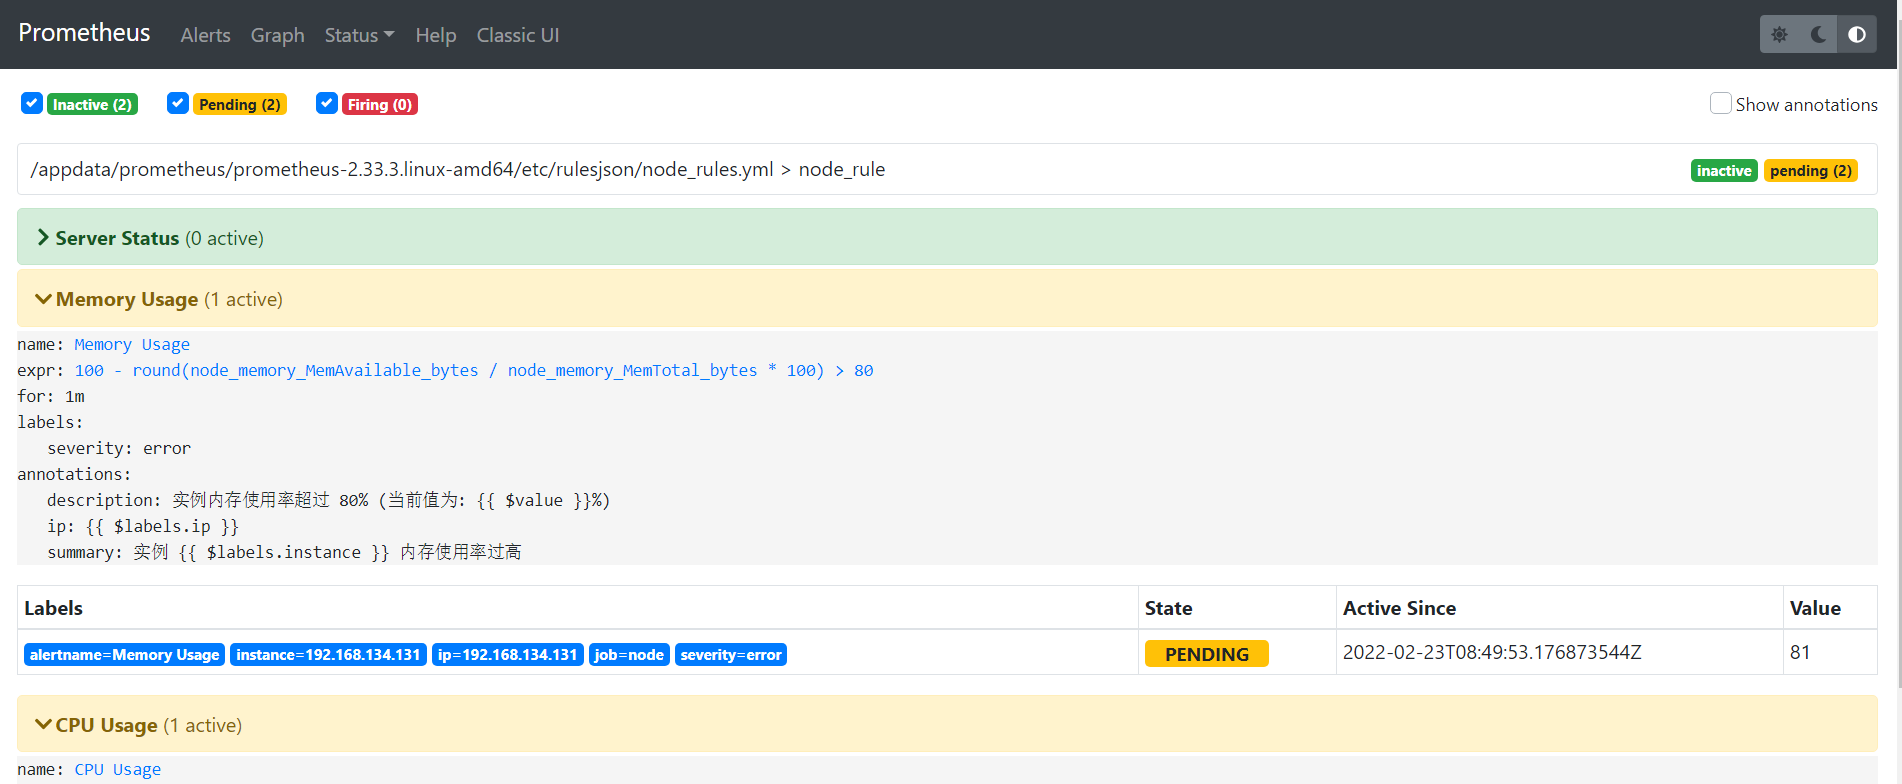
重启后访问http://ip:9090/查看prometheus是否启动成功,点击alerts就能看到配置的报警信息了,如下:
重启后访问http://ip:9093/查看alertmanager是否启动成功,如下:
接收测试
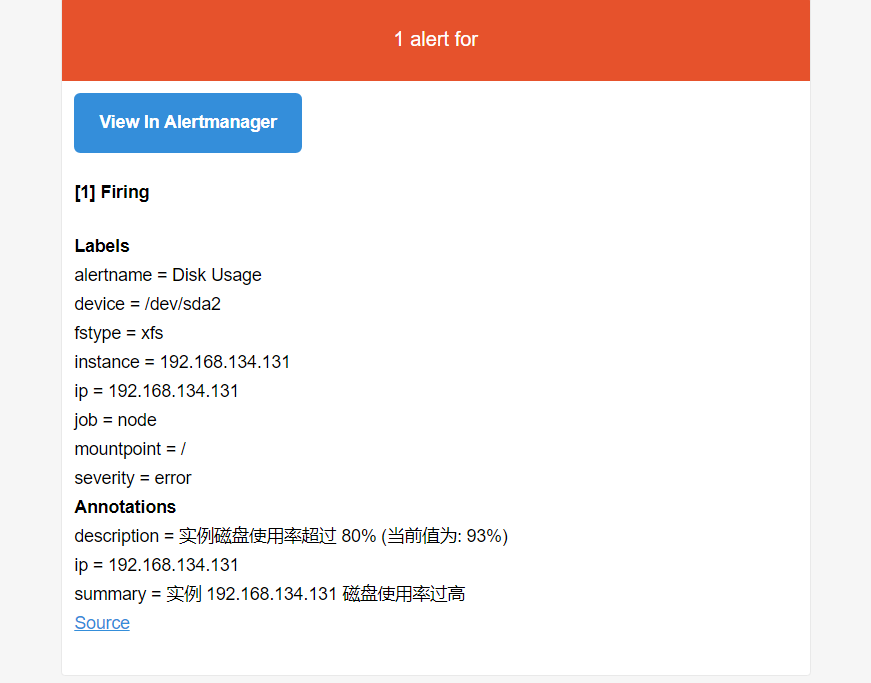
磁盘测试
说明:使用dd命令创建一个大文件,文件一定要占用盘存储空间的80%以上。
dd if=/dev/zero of=/test bs=1024m count=12
prometheus截图
邮件接收截图
cpu测试
说明:下载stress软件,如果你linux系统总的cpu线程有1个,那么设置测试的cpu一定要超过这个值。一般设置为2-3倍。
stress --cpu 3 --timeout 6000
prometheus截图
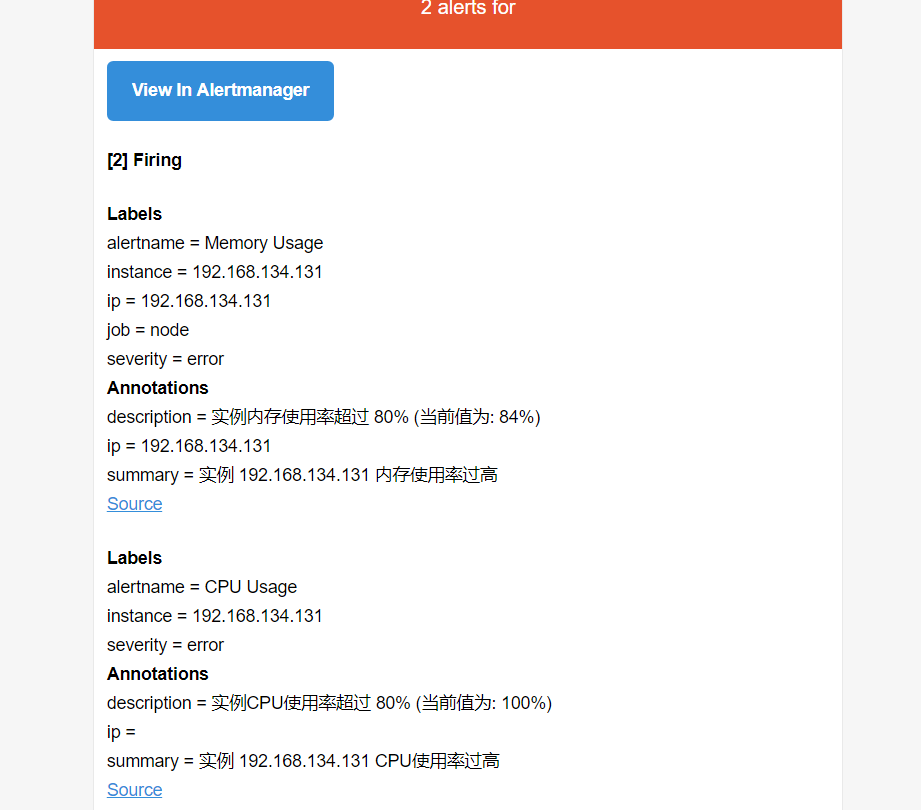
邮件接收截图
内存测试
说明:下载memtester软件,根据你实际的内存量设置合适的内存测试值,如你的主机有10g,那么按照设置告警的规则为80%才告警,你可以设置测试内存为9g。测试单位有b k m g自选。
./memtester 700m
prometheus截图(此时内存和cpu同时超过阈值)
邮件接收截图
主机down测试
说明:直接对一个监控节点进行关机操作,但是有一个问题prometheus监控是通过客户端的9100端口监控数据,一旦9100端口不通也会触发节点down告警。
shutdown -h now
prometheus截图
邮件接收截图